Graphing Compound Inequalities
We can write compound inequalities with two variables just as we do for one variable.
For example,

is a compound inequality. Because the inequalities are connected by the word and,
a point is in the solution set to the compound inequality if and only if it is in the
solution sets to both of the individual inequalities. So the graph of this compound
inequality is the intersection of the solution sets to the individual inequalities.
Example 1
Graphing a compound inequality with and
Graph the compound inequality

Solution
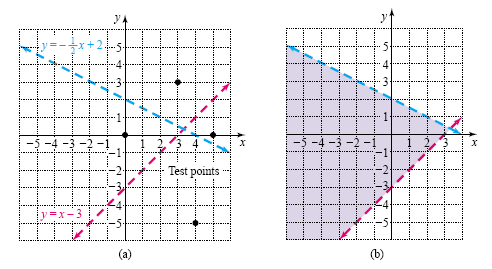
We first graph the equations y = x - 3 and
 . These lines divide the
plane into four regions as shown in figure (a) below. . These lines divide the
plane into four regions as shown in figure (a) below.

Now test one point of each region
to determine which region satisfies the compound inequality. Test the points (3, 3),
(0, 0), (4, -5), and (5, 0):
| 3 |
> 3 - 3 |
and |
3 |
 |
Second inequality is incorrect. |
| 0 |
> 0 - 3 |
|
0 |
 |
Both inequalities are correct. |
| -5 |
> 4 - 3 |
|
-5 |
 |
First inequality is incorrect. |
| 0 |
> 5 - 3 |
|
5 |
 |
Both inequalities are incorrect. |
The only point that satisfies both inequalities is (0, 0). So the solution set to the compound
inequality consists of all points in the region containing (0, 0). The graph of
the compound inequality is shown in figure (b) above.
Compound inequalities are also formed by connecting individual inequalities
with the word or. A point satisfies a compound inequality connected by or if and
only if it satisfies one or the other or both of the individual inequalities. The graph
is the union of the graphs of the individual inequalities.
Example 2
Graphing a compound inequality with or
Graph the compound inequality
2x - 3y ≤ 6 or x + 2y
≥ 4.
Solution
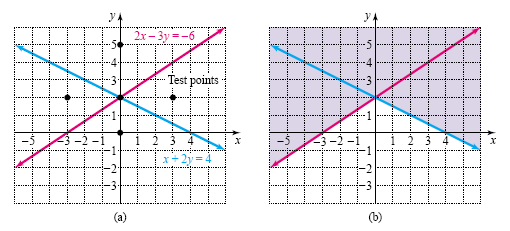
First graph the lines 2x - 3y = -6 and x + 2y = 4. If we graph the lines using
x- and y-intercepts, then we do not have to solve the equations for y. The lines are
shown in figure (a) below. The graph of the compound inequality is the set of all points
that satisfy either one inequality or the other (or both). Test the points (0, 0), (3, 2),
(0, 5), and (-3, 2). You should verify that only (0, 0) fails to satisfy at least one of
the inequalities. So only the region containing the origin is left unshaded. The graph
of the compound inequality is shown in figure (b) below.

Helpful Hint
When graphing a compound
inequality connected with“or,â€
shade the region that satisfies
the first inequality and then
shade the region that satisfies
the second inequality. If the
inequalities are connected
with “and,†then you must be
careful not to shade too much.
|