FreeAlgebra                             Tutorials!  
Home
Polynomials
Finding the Greatest Common Factor
Factoring Trinomials
Absolute Value Function
A Summary of Factoring Polynomials
Solving Equations with One Radical Term
Adding Fractions
Subtracting Fractions
The FOIL Method
Graphing Compound Inequalities
Solving Absolute Value Inequalities
Adding and Subtracting Polynomials
Using Slope
Solving Quadratic Equations
Factoring
Multiplication Properties of Exponents
Completing the Square
Solving Systems of Equations by using the Substitution Method
Combining Like Radical Terms
Elimination Using Multiplication
Solving Equations
Pythagoras' Theorem 1
Finding the Least Common Multiples
Multiplying and Dividing in Scientific Notation
Adding and Subtracting Fractions
Solving Quadratic Equations
Adding and Subtracting Fractions
Multiplication by 111
Adding Fractions
Multiplying and Dividing Rational Numbers
Multiplication by 50
Solving Linear Inequalities in One Variable
Simplifying Cube Roots That Contain Integers
Graphing Compound Inequalities
Simple Trinomials as Products of Binomials
Writing Linear Equations in Slope-Intercept Form
Solving Linear Equations
Lines and Equations
The Intercepts of a Parabola
Absolute Value Function
Solving Equations
Solving Compound Linear Inequalities
Complex Numbers
Factoring the Difference of Two Squares
Multiplying and Dividing Rational Expressions
Adding and Subtracting Radicals
Multiplying and Dividing Signed Numbers
Solving Systems of Equations
Factoring Out the Opposite of the GCF
Multiplying Special Polynomials
Properties of Exponents
Scientific Notation
Multiplying Rational Expressions
Adding and Subtracting Rational Expressions With Unlike Denominators
Multiplication by 25
Decimals to Fractions
Solving Quadratic Equations by Completing the Square
Quotient Rule for Exponents
Simplifying Square Roots
Multiplying and Dividing Rational Expressions
Independent, Inconsistent, and Dependent Systems of Equations
Slopes
Graphing Lines in the Coordinate Plane
Graphing Functions
Powers of Ten
Zero Power Property of Exponents
The Vertex of a Parabola
Rationalizing the Denominator
Test for Factorability for Quadratic Trinomials
Trinomial Squares
Solving Two-Step Equations
Solving Linear Equations Containing Fractions
Multiplying by 125
Exponent Properties
Multiplying Fractions
Adding and Subtracting Rational Expressions With the Same Denominator
Quadratic Expressions - Completing Squares
Adding and Subtracting Mixed Numbers with Different Denominators
Solving a Formula for a Given Variable
Factoring Trinomials
Multiplying and Dividing Fractions
Multiplying and Dividing Complex Numbers in Polar Form
Power Equations and their Graphs
Solving Linear Systems of Equations by Substitution
Solving Polynomial Equations by Factoring
Laws of Exponents
index casa mío
Systems of Linear Equations
Properties of Rational Exponents
Power of a Product and Power of a Quotient
Factoring Differences of Perfect Squares
Dividing Fractions
Factoring a Polynomial by Finding the GCF
Graphing Linear Equations
Steps in Factoring
Multiplication Property of Exponents
Solving Systems of Linear Equations in Three Variables
Solving Exponential Equations
Finding the GCF of a Set of Monomials
 
Try the Free Math Solver or Scroll down to Tutorials!


Please use this form if you would like
to have this math solver on your website,
free of charge.


Graphing Compound Inequalities

Graphing the Solution Set to a Compound Inequality

The soloution set to a compound inequality such as

x > 2 and x < 5

consists of all numbers that are in the solution sets to both simple inequalities. So the solution set to this compound inequality is the intersection of those two solution sets. In symbols,

{x | x > 2 and x < 5} = {x | x > 2} Ç {x | x < 5}.


Example 1

Graphing compound inequalities

Graph the solution set to the compound inequality x > 2 and x < 5.

Solution

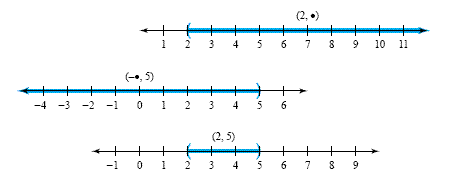
We first sketch the graph of x > 2 and then the graph of x < 5, as shown in the top two number lines in the figure below. The intersection of these two solution sets is the portion of the number line that is shaded on both graphs, just the part between 2 and 5, not including endpoints. The graph of {x | x > 2 and x < 5} is shown at the bottom of the figure. We write this set in interval notation as (2, 5).
The solution set to a compound inequality such as

x > 4 or x < -1

consists of all numbers that satisfy one or the other or both of the simple inequalities. So the solution set to the compound inequality is the union of the solution sets to the simple inequalities. In symbols,

{x | x > 4 or x < -1} = {x | x > 4 } È {x | x < -1}


Example 2

Graphing compound inequalities

Graph the solution set to the compound inequality x > 4 or x < -1.

Solution

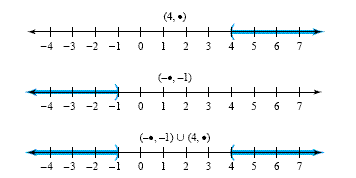
To find the union of the solution sets to the simple inequalities, we sketch their graph as shown at top of the figure that appears below. We graph the union of these two sets by putting both shaded regions together on the same line as shown in the bottom graph of the figure. This set is written in interval notation as

(-∞, -1) È (4, )


Caution

When graphing the intersection of two simple inequalities, do not draw too much. For the intersection, graph only numbers that satisfy both inequalities. Omit numbers that satisfy one but not the other inequality. Graphing a union is usually easier because we can simply draw both solution sets on the same number line.

It is not always necessary to graph the solution set to each simple inequality before graphing the solution set to the compound inequality.We can save time and work if we learn to think of the two preliminary graphs but draw only the final one.


Example 3

Overlapping intervals

Sketch the graph and write the solution set in interval notation to each compound inequality.

a) x < 3 and x < 5

b) x > 4 or x > 0

Solution

a) To graph x < 3 and x < 5, we shade only the numbers that are both less than 3 and less than 5. So numbers between 3 and 5 are not shaded in the figure below. The compound inequality x < 3 and x < 5 is equivalent to the simple inequality x < 3. The solution set can be written as (-∞, 3).

b) To graph x > 4 or x > 0, we shade both regions on the same number line as shown on the figure below. the compound inequality x > 4 or x > 0 is equivalent to the simple inequality x > 0. The solution set is (0, )

All Right Reserved. Copyright 2005-2024