Graphing Functions
Example
Graph the function: f(x) = 2|x| - 4
Solution
Step 1 Make a table of ordered pairs.
We’ll let x = -6, -3, 0, 3, and 6.
|
x |
f(x)
= 2|x| - 4 |
(x, y) |
|
-6
3
0
3 6 |
f(-6)
= 2|-6| - 4
= 2 ·
6 - 4 = 12 - 4 = 8
f(3) = 2|3|
- 4
= 2 ·
3 - 4 = 6 - 4 = 2
f(0) = 2|0|
- 4
= 2 ·
0 - 4 = 0 - 4 = -4
f(3) = 2|3|
- 4
= 2 ·
3 - 4 = 6 - 4 =
2
f(6) = 2|3|
- 4
= 2 ·
6 - 4 = 12 - 4 = 8 |
(-6, 10) (-3, 2)
(0, -4)
(3, 2) (6, 8) |
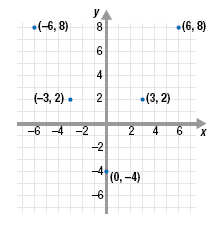
Step 2 Plot the ordered pairs.

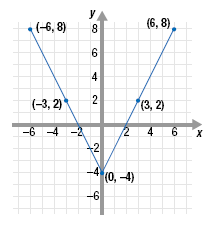
Step 3 Connect the plotted points.

Note:
f(x) = 2|x| - 4 is called an absolute value
function.
The graph of an absolute value function
consists of two lines that form a vee, such as
 or or

|