Graphing Linear Equations in the Coordinate Plane
Graphing a Linear Equation
The solution set to an equation in two variables consists of all ordered
pairs that satisfy the equation. For example, the solution set to y = 2x + 3 can
be written in set notation as {(x, y) | y =
2x + 3}. However, this set notation does not shed any light on the solution set
to y = 2x + 3. We can get a better understanding of the solution set with a
visual image or graph of the solution set.
Example
Graphing a linear equation
Graph the solution set to y = 2x + 3.
Solution
If we arbitrarily choose x = -4, then y is determined by the equation y = 2x
+ 3:
y = 2(-4) + 3 = -5
So the ordered pair (-4, -5) satisfies the equation. In this manner we can
make the following table of ordered pairs:
|
x |
-4 |
-3 |
-2 |
-1 |
0 |
1 |
|
y = 2x + 3 |
-5 |
-3 |
-1 |
1 |
3 |
5 |
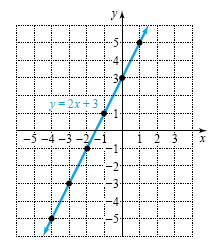
Plot these ordered pairs as shown in the figure below. Of course, there are
infinitely many ordered pairs that satisfy y = 2x + 3, but they all lie along
the line in the figure below. The arrows on the ends of the line indicate that
it extends without bound in both directions. The line in this figure is a graph
of the solution set to y = 2x + 3.

In an equation such as y = 2x + 3 the value of y depends on the value of x.
So x is the independent variable and y is the dependent variable.
Because the graph of y = 2x + 3 is a line, the equation is a linear equation.
|