Power Equations and their Graphs
To represent patterns that are more complicated than straight lines, a different type of
equation is needed. Power functions are capable of representing patterns in curved
graphs. The equation of a power function always follows the pattern:
y = k · x p,
where:
• The letter x represents the values of the input,
• The letter y represents the values of the output,
• k is a number called the constant of proportionality, and,
• p is a number called the power.
The Graph of a Power Equation
Power equations are excellent tools for representing three basic types of pattern. The
appearance of the graph generated by the power equation depends very strongly on the
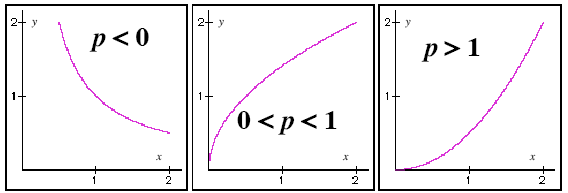
numerical value of the power, p, as shown in Figure 1 (below)

Figure 1: When the constant of proportionality, k, is positive the appearance of the graph generated by a power equation
depends on the numerical value of the power, p. When p is negative (p < 0) the graph decreases, flattening out as it goes.
When p is between 0 and 1 (0 < p < 1) the graph increases, flattening out as it goes. When p is greater than 1 (p > 1)
the graph increases, getting steeper and steeper as it goes.
The relationship between the numerical value of the power p in the power equation:
y = k · x p,
and the appearance of the graph generated by the power equation are summarized in
Table 1 (below).
| Value of the power, p |
Value of the power, p
(Symbols)
|
Appearance of the graph
generated by the power
equation |
| Negative |
p < 0 |
When read from left to right
the graph decreases in
height, getting flatter and
flatter as it goes.
|
| Between zero and one |
0 < p < 1 |
When read from left to right
the graph increases in
height, getting flatter and
flatter as it goes. |
| Greater than one |
p > 1 |
When read from left to right
the graph increases in
height, getting steeper and
steeper as it goes. |
Table 1: Summary of the relationship between the power, p, and the appearance of the graph.
|